
Let’s be real — almost every meaningful move the price makes starts or stalls at a key support or resistance level. These zones are like invisible “traffic lights” in the price action — where the movement often pauses, reverses, or breaks through with force.
That’s why I always say:
💡“If you don’t know where support and resistance are…
you’re flying blind.”
1. What makes Support & Resistance so important?
First of all,
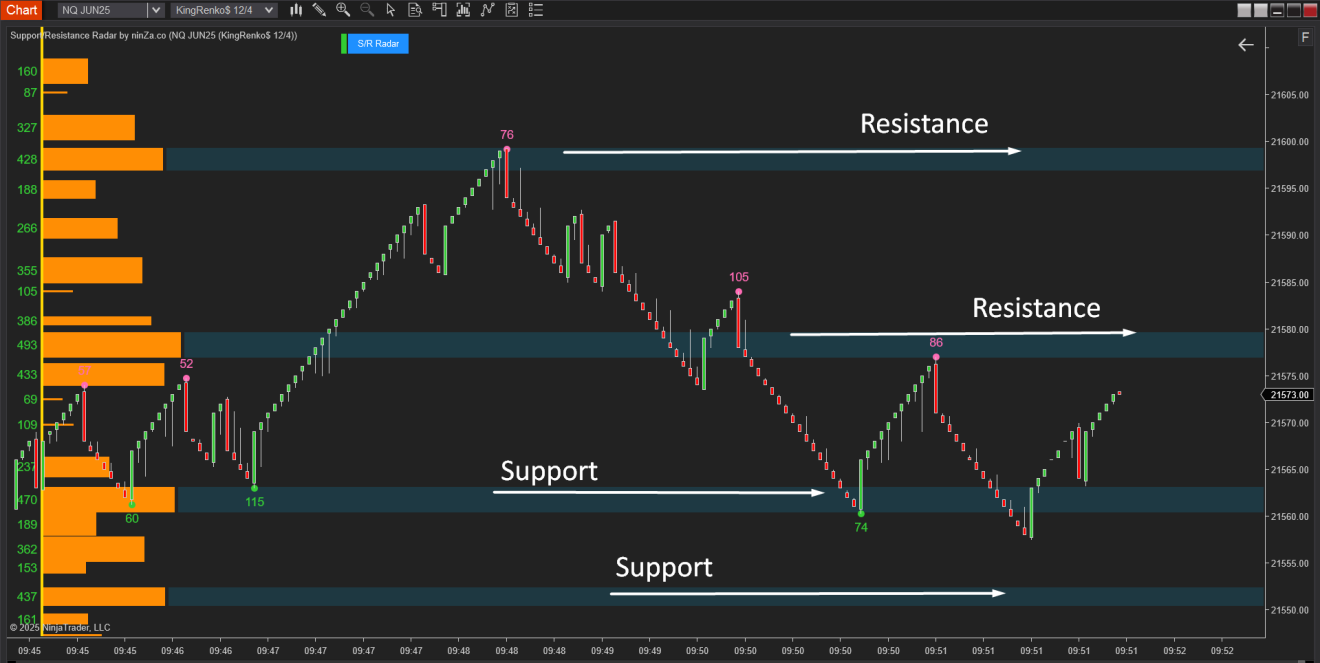
Support = area where buying tends to come in.
Resistance = area where sellers start pushing back.
These aren’t just lines we draw for fun — they are psychological zones where thousands of traders are watching, waiting, or reacting. Often, big players are loading or unloading there.
Knowing your S/R zones:
- Helps you avoid buying right into resistance or shorting into support
- Gives you high-probability entry zones
- Lets you tighten stops and set targets more logically
- Warns you about choppy/no-go zones
2. How do I trade with Support & Resistance?
Here’s a simple strategy I often use:
- Wait for price to come into a major zone (either support or resistance).
- Look for confirmation — a reversal candle, divergence, or strong rejection wick.
- Enter in the direction of the bounce, set stop just past the zone, and target the next key level.
- If price breaks through the zone strongly, I switch mindset to breakout trading — retests become entries.
But Here’s the Issue…
Most traders struggle to draw accurate S/R levels consistently.
And let’s be honest — eyeballing swing highs and lows manually? That gets messy fast.
That’s where Support/Resistance Radar comes in.
3. Introducing Support/Resistance Radar
The smarter way to detect real zones — built from swing points + radar logic.
This isn’t your basic line-drawing tool. It took our team 2 years to develop, combining:
- Swing Point Analysis (core of our Divergence Engine$)
- Zone Grouping Logic (clusters swing points by strength and proximity)
- Radar-Style Visualization (inspired by volume/market profile)
- Proprietary S/R Algorithm to show zones with real meaning
The result? A unique S/R indicator that automatically maps high-probability zones where price is likely to:
- Bounce
- Stall
- Reverse
Each zone adapts as the chart evolves — using a delay of N bars (default = 10) to accurately confirm true swing highs/lows. And no, the delay doesn’t hurt — because great zones stay relevant for tens or even hundreds of bars later.
Modes You Can Choose From:
- SwingStrength: Measures the power of each bounce. Great for weighting zones based on impact.
- SwingCount: Measures the number of swing points in a zone. Ideal for spotting heavily tested areas.
Real Talk: You’ll Be Surprised
When I first added this to my chart, I was stunned by how often the price respected these zones — even hours or days later. It’s like radar for your trading — not just showing you where to go, but where not to mess around.
Whether you’re a scalper, swing trader, or trend follower, this tool gives you the map — you just follow it.
Want to check it out or see how it looks on a real chart?
Let me know — I can drop screenshots or a walkthrough.
Trade smart,
Grace.
Leave a Reply